3(x-2)=12 Solve the equation above for x. Which of the following is the correct answer?
A. 6
B. -2
C. -4
D. 2
: In order to solve for the value of x, we use the order of operations as follows:
The first step is to divide both sides by 3


Add 2 to both sides to eliminate it from the left-hand side of the equation
x-2+2=4+2
x = 6
Thus, the value of x is 6.
Therefore, the Correct Answer is A.
More Questions on TEAS 7 Math
-
Q #1: An athlete runs 5 miles in 25 minutes and then changes their pace to run the next 3 miles in 15 minutes. Overall, what is the average time in minutes it takes the athlete to run 1 mile?
A. 7 minutes
B. 5 minutes
C. 6.5 minutes
D. 8.5 minutes
Answer Explanation
to find the average time the athlete runs in 1 mile, find total time divided by total distance covered in the two runs.
Total distance=5+3=8 miles
Total time=25+15=40 minutes
We now know that the athlete runs 8 miles in 40 minutes, so the time the athlete will run in 1 mile will be:
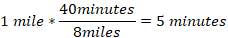
In 5 minutes, the athlete runs 1 mile.
-
Q #2: Which of the following is the greatest value?
A. 43÷55
B. 5/7
C. 0.729
D. 73%
Answer Explanation
we are asked to find the largest value from the options given. To solve this problem, we need to convert all the given values into fraction. Then find the least common denominator for all fractions, which we will use to multiply each fraction and make a comparison.
43÷
 55=43/55
5/7
0.729=729/1000
73%=73/100
Now, we need to find the least common denominator of 55, 7, 1000, and 100, which is 77000. We multiply each fraction by 77000 as follows:
43/55*77000=60200
5/7*77000=55000
729/1000*77000=56133
73/100*77000=56210
From the calculated values, it can be noted that 43/55 is the greatest value among the given options.
-
Q #3: The table below shows the student’s score at the end of the semester. Which of the following would best display the data? Subject Math Chemistry Biology Physics English Test scores 90 72 85 95 63
A. Stem and leaf plot
B. Line graph
C. Bar graph
D. Scatter plot
Answer Explanation
The best way to visualize the student’s score for each subject is to plot them using a bar graph.
-
Q #4: "Twelve less than thrice a number." Which of the following translates the phrase above into a mathematical expression?
A. 3x-12
B. 12-3x
C. 3-12x
D. 12x-3
Answer Explanation
We convert the given word problem into a mathematical expression.
Let the number be x.
Thrice a number = 3x
Twelve less than thrice a number = 3x-12
Thus, the required mathematical expression is 3x-12
-
Q #5: A teacher earns $730.00 per week before any tax deductions. The following taxes are deducted each week: $72.00 federal income tax, $35.00 state income tax, and $65.00 Social Security tax. How much will the teacher make in 4 weeks after taxes are deducted?
A. $2,250.00
B. $2,550.00
C. $2,400.00
D. $2,232.00
Answer Explanation
The net income is the salary of the teacher gets after deducting total taxes.
Weekly net income=weekly gross income-total tax
Total tax=federal income tax+state income tax+Social Security tax
Total tax=$(72.00+35.00+65.00)
Total tax=$172.00
Weekly net income=$(730.00-172.00)=$558.00
The net income the teacher gets in 4 weeks is what she gets in one week multiplied by 4
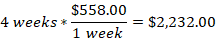
The teacher will earn a net income of $2,232.00 in 4 weeks after taxes are deducted.
-
Q #6: Which of the following relationships represents a no correlation between two variables?
A. As a student’s class attendance decreases, the student’s overall grade remains the same
B. As the number of hours a person exercises decreases, the weight of that person increases
C. As the number of miles driven increases, the amount of the gasoline in the tank decreases
D. As the amount of water plant receives increases, the growth rate of the plant increase.
Answer Explanation
Correlation of two variables falls into:
Positive correlation: an increase in one variable causes another variable to increase
Negative correlation: an increase in one variable causes another one to decrease
No correlation: a change in one variable does not cause any response in another variable.
From the given choices
Option a is no correlation
Option b is a negative correlation
Option c is a negative correlation
Option d is a positive correlation
Thus, the correct statement is a.
-
Q #7: Which of the following values is the greatest?
A. 11/2
B. 5.4
C. 13/3
D. 6.25
Answer Explanation
Before we compare the values of the options, we convert the decimals to fractions.
5.4 becomes 54/10
6.25 becomes 625/100
Thus, the set of fractions is 11/2, 54/10, 13/3, 625/100. The least common denominator for 2, 10, 3, and 100 is 300, which we use to compare each options given.
11/2*300=1650
54/10*300=1620
13/3*300=1300
625/100*300=1875
From the above, 1875 is the greatest value which corresponds to 6.25. Therefore, 6.25 is the greatest value of all the choices given.
-
Q #8: How may milliliters are there in 3.2 liters?
A. 0.32
B. 32
C. 3200
D. 320
Answer Explanation
We know that 1 L =1000 mL, which we use to convert between the two units. The conversion fractions of interconverting are:

And

Since we want to end up with millimeters, the second conversion is used in converting L to mL as:
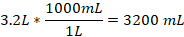
Thus, 3.2 L is equivalent to 3200 mL.
-
Q #9: A teacher has asked all the students in the class which data visualizer he will use to show relationship between their scores and number of subjects. Which of the following is the best way to display the frequency of each day of the week?
A. Histogram
B. Scatterplot
C. Pie graph
D. Bar graph
Answer Explanation
Histograms are used to present frequency of data of one variable over the other. On the other hand, a bar graph is used to compare the two variables with the rectangles not touching one another as in histograms. Scatter plots are used to show the correlations between two variables. In this case, the teacher will be able to use scatter plot to establish the correlation between test scores and the subjects.
-
Q #10: Which of the following is the correct decimal placement for the product of 1.6*0.93?
A. 14.88
B. 0.1488
C. 1.488
D. 0.001488
Answer Explanation
We use a calculator to find the product of
1.6*0.93=1.488

