4(x-5)=8 Solve the equation above for x. Which of the following is the correct answer?
A. ¾
B. 3 ¼
C. -3
D. 7
In order to solve for the value of x, we use the order of operations as follows:
The first step is to divide both sides by 4


Since 5 is subtracted, we add 5 to both sides to eliminate it from the left-hand side of the equation

Thus, the value of x is 7.
Therefore, the Correct Answer is D.
More Questions on TEAS 7 Math
-
Q #1: Lana has $60. She spends 80% of the money. She then invests the remaining amount and earns a profit of 80%. How much money does she now have?
A. $21.60
B. $86.40
C. $9.60
D. $60
Answer Explanation
we are needed to find the amount Lana is left with after spending and investing the rest using the given information.
Amount Lana spends = 80% of $60= 80/100 * 60 = $48
Amount left to invest = $(60-48) = $12
Lana is left with $12, which she invests and earns a profit of 80%.
Profit earned = 80% of $12 = 80/100 * 12 = $9.20
So, Lana will have $12 + $9.20 = $21.60
-
Q #2: A sweater that normally sells for $87 is marked 25% off. Which of the following estimates the sale price of the sweater?
A. $51
B. $36
C. $22
D. $65
Answer Explanation
: we are to find the selling price of the sweater after subtracting the mark off price.
Mark off value=mark off rate*original price
Mark of value=25%*$87
We convert 25% into a fraction, which become 25/100=0.25. Then
Mark of value=0.25*$87=$21.75
The selling price of the sweater will be the original price less the mark off value. Then,

Thus, the approximate selling price of the sweater is $65.
-
Q #3: Which of the following values is the greatest?
A. 9/2
B. 4.4
C. 10/3
D. 4.25
Answer Explanation
The initial step is to convert the decimal numbers into fractions.
4.4 becomes 44/10
4.25 becomes 425/100
Thus, the set of fractions is 9/2, 44/10, 10/3, 425/100. The least common denominator for 2, 10, 3, and 100 is 300, which we use to compare each options given.
9/2*300=1350
44/10*300=1320
10/3*300=1000
425/100*300=1275
From the above, 1350 is the greatest value which corresponds to 9/2. Thus, 9/2 is the greatest value of all the choices given.
-
Q #4: A nurse earns $800.00 per week before any tax deductions. The following taxes are deducted each week: $83.00 federal income tax, $38.00 state income tax, and $79.00 Social Security tax. How much will the nurse make in 4 weeks after taxes are deducted?
A. $2,600.00
B. $3,000.00
C. $2,400.00
D. $2,800.00
Answer Explanation
we need to find the net income of the nurse in 4 weeks from the weekly net income.
Weekly net income=gross income-total tax
Total tax=federal income tax+state income tax+Social Security tax
Total tax=$(83.00+38.00+79.00)
Total tax=$200.00
Weekly net income=$(800.00-200.00)=$600.00
In one week, the net income of the nurse is $600.00 and in 4 weeks the nurse will a net income of:
The nurse will earn $2,400.00 in 4 weeks after taxes are deducted.
-
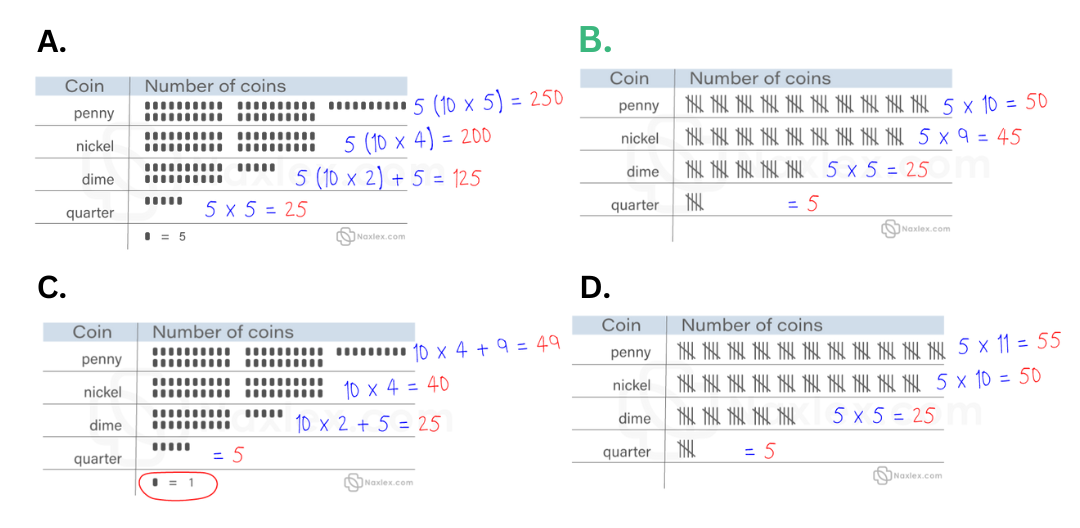
Q #5: A child has collected 50 pennies, 45 nickels, 25 dimes, and 5 quarters. Which of the following charts accurately organizes the number of coins?
A. A
B. B
C. C
D. D
Answer Explanation
In this scenario, we use the given scale in the charts to find the number of each coin and selected the right number of coins the student collected. The second options shows that the child collected 50 pennies, 45 nickels, 25 dimes, and 5 quarters.
-
Q #6: Which of the following percentages is equivalent to the fraction below? 5/8
A. 1.6%
B. 6.25%
C. 62.5%
D. 160%
Answer Explanation
to convert fraction to percent, we multiply the fraction with 100. Therefore, the percent equivalent of 5/8 is
Thus, 5/8 is equal to 62.5%.
-
Q #7: A recipe calls for 2.5 teaspoons of vanilla. 1 teaspoon equals approximately 4.93 mL. Which of the following is the correct amount of vanilla in mL?
A. 5.33 mL
B. 12.325 mL
C. 7.43 mL
D. 0.507 mL
Answer Explanation
We need to find how many mL are in 2.5 teaspoons. We need to use dimensional analysis to solve this problem as follows.
Converting between teaspoon and mL uses the following conversions:

Or

We want to end up with mL, we utilize the second conversion and set up the following equation.
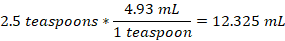
Thus, 2.5 teaspoons can hold 12.325 mL.
-
Q #8: 2.50*0.25 Simplify the expression above. Which of the following is correct?
A. 0.0625
B. 6.025
C. 0.625
D. 6.25
Answer Explanation
To solve this equation, we use a calculator and find the product as:
2.50*0.25=0.625
-
Q #9: Four friends are sharing a pizza. One friend eats half of the pizza. The other three friends equally divide the rest among themselves. What portion of the pizza did each of the other three friends receive?
A. 1/6
B. 1/3
C. ¼
D. 1/5
Answer Explanation
we are needed to find the portion of pizza shared by 3 three friends. We treat the whole pizza as 1. Now, 1 friend eats half of the whole pizza. Thus,
One friend=1/2 of 1=1/2*1=1/2
Remaining amount=1-1/2=2/2-1/2=1/2
Thus, ½ of pizza is left for three friends to share among themselves. Then, each friend will get
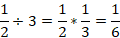
So, the other three friends will each get 1/6 of the pizza.
-
Q #10: A teacher has asked all the students in the class which days of the week they get up after 8 a.m. Which of the following is the best way to display the frequency of each day of the week?
A. Histogram
B. Scatterplot
C. Pie graph
D. Bar graph
Answer Explanation
The best way to display the frequency of each day of the week when students get up after 8 a.m. is by using a bar graph. Bar graphs are well-suited for representing categorical data, where each day of the week is a separate category, and the height of each bar corresponds to the count or frequency of students waking up late on that specific day.
Note: Histograms, on the other hand, are more appropriate for visualizing continuous or numerical data and are not ideal for categorical data like days of the week. Histograms are useful for understanding the distribution of data, identifying patterns, and assessing the shape of the data distribution, such as whether it's normally distributed, skewed, or has multiple modes.
As you can see below, the Histogram is used to depict a pattern/continuous/range data. While a bar graph does just fine even with discrete data.


