A farmer is planning for a growing season and want to know the trend in amount of rainfall in his area. He obtains rainfall falling in the first 5 months of the year as shown in the above table. Which of the following would best display the data? Month January February March April May Rainfall (mm) 20 6 14 28 34
A. Scatter plot
B. Pie chart
C. Line graph
D. Bar graph
Based rainfall falling for the first 5 months, a bar graph will give a great display for the farmer to decide when start planting. The horizontal scale will represent months of the year and vertical scale will present the amount of rainfall falling.
Therefore, the Correct Answer is D.
More Questions on TEAS 7 Math
-
Q #1: Which of the following relationships represents a negative correlation between two variables?
A. As a student’s class attendance decreases, the student’s overall grade remains the same
B. As the number of hours a person exercises decreases, the weight of that person remains unchanged
C. As the number of miles driven increases, the amount of the gasoline in the tank decreases
D. As the amount of water plant receives increases, the growth rate of the plant increase.
Answer Explanation
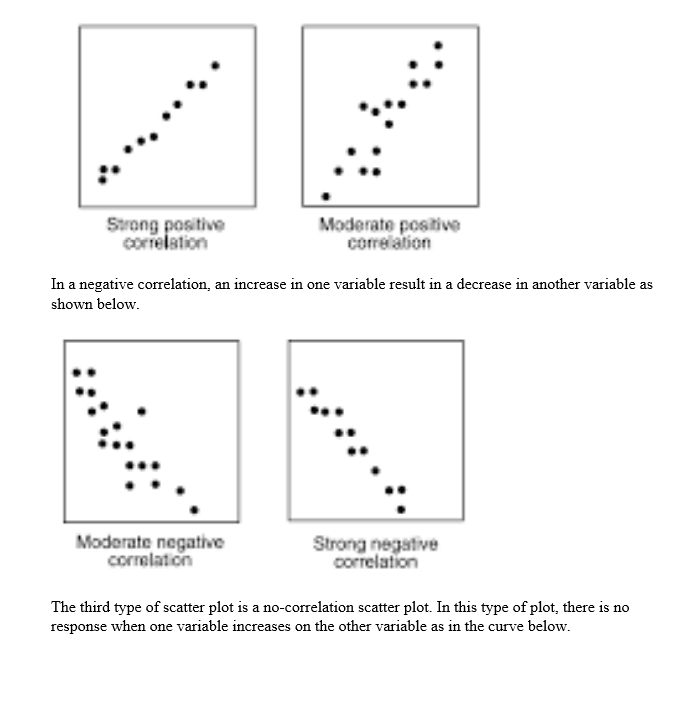
Correlation of two variables falls into:
Positive correlation: an increase in one variable causes another variable to increase
Negative correlation: an increase in one variable causes another one to decrease
No correlation: a change in one variable does not cause any response in another variable.
From the given choices
Option a is no correlation
Option b is a no correlation
Option c is a negative correlation
Option d is a positive correlation
-
Q #2: One gallon of cleaning solution requires 10 oz of ammonia. If the maintenance department needs 51 gallons of solution to clean all of the floors, how much ammonia is needed?
A. 510 gallons
B. 51 gallons
C. 510 oz
D. 51 oz
Answer Explanation
We use given information to find how much ammonia is need to make the specified solution.
We are told, one gallon of cleaning solution requires 10 oz of ammonia. Expressing this mathematically yields two options:
\(\frac{10\ oz\ of\ ammonia}{1\ gallon\ of\ solution}\) or \(\frac{1\ gallon\ of\ solution}{10\ oz\ of\ ammonia}\)
Now we find how much ammonia is needed using option two.
\(51\ gallon\ of\ solution\ *\frac{10\ oz\ of\ ammonia}{1\ gallon\ of\ solution}\ =\ 510\ oz\ of\ ammonia\)
From the above equation, gallon of solution will cancel, and oz of ammonia is left.
Therefore, the solution will require 510 oz of ammonia.
-
Q #3: The graph below represents the amount of rainfall in a particular state by month. Which of the following is the total rainfall for the first 5 months of the year?
A. 11 inches
B. 7.5 inches
C. 4.5 inches
D. 3.5 inches
Answer Explanation
The first five months of the year are January, February, March, April, and May. We use to graph to find the amount of rainfall in each month as follows:
In the month of January, rainfall was between o and 1, which is halfway. Therefore, rainfall in January is 0.5 inches
On February, rainfall was 1 inch and on March the rainfall was 2 inches.
On April, the rainfall amount was 4 inches while on month of May, the rainfall was about 3.5 inches. Therefore, total rainfall in the first 5 months was:
Total rainfall=0.5 inches+1 inches+ 2 inches+4 inches + 3.5 inches =11 inches
-
Q #4: The scatter plot below shows the relationship between the number of hours a student plays golf and the student’s class attendance. Which of the following types of correlation is shown on the scatter plot?
A. Positive
B. Positive and negative
C. No correlation
D. Negative
Answer Explanation
Scatter plots can depict three correlations: positive, negative and no correlation. A positive correlation scatter plot reveals that as one variable increases, the other variable also increases as shown below
-
Q #5: Which of the following is the equivalence in kg for 220 lb? (2.2 lb =1 kg)
A. 110 kg
B. 2.20 kg
C. 50 kg
D. 100 kg
Answer Explanation
We two conversions when asked to convert between kg and lb

And

We need kg equivalent of 220 lb, therefore we use option 1 and carry out the conversions as follows:
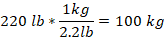
Thus, 100kg is equal to 220lb.
-
Q #6: Which of the following percentages is equivalent to the fraction below? 7/8
A. 875%
B. 0.875%
C. 8.75%
D. 87.5%
Answer Explanation
We are required to find the percent equivalent of the given fraction.
We multiply 7/8 by 100 to convert it to percent. You convert fraction to percent.

Thus 7/8 is equal to 87.5%.
-
Q #7: A doctor earns $980.00 per week before any tax deductions. The following taxes are deducted each week: $85.00 federal income tax, $40.00 state income tax, and $81.00 Social Security tax. How much will the doctor make in 4 weeks after taxes are deducted?
A. $3,096.00
B. $3,00.00
C. $3,00.00
D. $3,200.00
Answer Explanation
We are required to find the doctor’s earning in 4 weeks after taking off taxes.
The first step is to find the total weekly deductions as follows:
Total weekly tax=federal income tax + state income tax + Social Security tax
Total weekly tax=$(85.00+40.00+81.00)
Total tax=$206.00
The next step is to find the weekly income after deducting total taxes
Weekly net income=gross income-total tax
Weekly net income=$(980.00-206.00)=$774.00
In one week, the net income of the doctor is $774.00 and after 4 weeks, the net income will be 4 times his weekly earning
-
Q #8: A farmer is planning for a growing season and want to know the trend in amount of rainfall in his area. He obtains rainfall falling in the first 5 months of the year as shown in the above table. Which of the following would best display the data? Month January February March April May Rainfall (mm) 20 6 14 28 34
A. Scatter plot
B. Pie chart
C. Line graph
D. Bar graph
Answer Explanation
Based rainfall falling for the first 5 months, a bar graph will give a great display for the farmer to decide when start planting. The horizontal scale will represent months of the year and vertical scale will present the amount of rainfall falling.
-
Q #9: Which of the following statements is true about the following graph?
A. The Chargers points per game decreased between seasons five times between 1996 and 2015
B. The Chargers scored their lowest number of points per game in 1999-2000 season
C. The Chargers scored their greatest number of points per game in the 2002-03 season
D. None of the above
Answer Explanation
We analyze the given statement with the graph given as follows:
For option a: the points per game decreased five times between 1996 and 2015. So, the statement is true.
For option b: the lowest points scored per game was in 1998-99 season. So, the statement is false.
For option c: 2008-09 was the season the chargers scored the greatest number of points per game and not 2002-03 as claimed in the statement. So, this statement is not true.
-
Q #10: A class of 40 students has 18 boys and 22 girls. What is ratio of girls to boys in the class?
A. 11:9
B. 20:9
C. 9:11
D. 20:11
Answer Explanation
A ratio is of the form a : b but can also be converted to a fraction of the form a/b, where b is not equal to zero. Besides, to in ration means per in fraction form.
In the class of 40 students, 22 are girls and 18 are boys. Thus, the ratio of girls to boys becomes:

The above fraction can be reduced further since 2 is a common factor in both 22 and 18. Thus
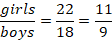
In ratio form, girls: boys=11:9
Thus, the ratio of girls to boys in a class of 40 students is 11 to 9.

