A large pizza has a diameter of 9 inches. Which of the following is the area of the pizza in terms of pi ()?
A. 11.25 πin2
B. 29.57 πin2
C. 18.35 πin2
D. 20.25 πin2
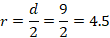
We need to find the radius in order to find the area of the pizza.
Radius of pizza
The area of the pizza

But r=4.5
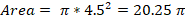
Thus, the area of the pizza is 20.25  in2.
in2.
NOTE:  is used as is since values of pi may vary e.g. 3.14, 3.142, 22/7. Hence we use pi symbol to generalize.
Therefore, the Correct Answer is D.
More Questions on TEAS 7 Math
-
Q #1: A couple dining at a restaurant receives a bill for $58.60. They wish to leave a 16% gratuity. Which of the following is the estimated gratuity?
A. $8.48
B. $6.40
C. $9.38
D. $7.00
Answer Explanation
In this problem, we need to find the amount of gratuity the couple will leave. The gratuity is 16% of the total bill. Before solving the problem, the following are terms and their meaning in percent problems:
- Is means equals
- Of means multiply
- What means unknown (variable)
If we let x be the amount of gratuity, then translating the given problem into a mathematical equation becomes:
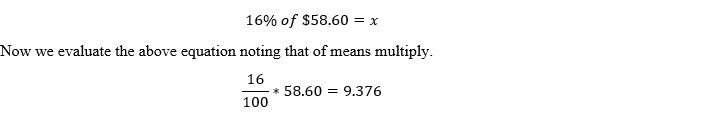
So, the value of x=9.376 and to the nearest cent, x=9.38
There, a couple will leave a gratuity of $9.38.
-
Q #2: Simplify the expression below. Which of the following is correct? 3.45 * 0.53
A. 1.8285
B. 18.285
C. 0.18285
D. 182.85
Answer Explanation
To solve the equation this equation, we use a calculator and find the product as:
3.45 * 0.53 = 1.8285
-
Q #3: Which of the following relationships represents a no correlation between two variables?
A. As a student’s class attendance decreases, the student’s overall grade remains the same
B. As the number of hours a person exercises decreases, the weight of that person increases
C. As the number of miles driven increases, the amount of the gasoline in the tank decreases
D. As the amount of water plant receives increases, the growth rate of the plant increase.
Answer Explanation
Correlation of two variables falls into:
Positive correlation: an increase in one variable causes another variable to increase
Negative correlation: an increase in one variable causes another one to decrease
No correlation: a change in one variable does not cause any response in another variable.
From the given choices
Option a is no correlation
Option b is a negative correlation
Option c is a negative correlation
Option d is a positive correlation
Thus, the correct statement is a.
-
Q #4: A large pizza has a diameter of 9 inches. Which of the following is the area of the pizza in terms of pi ()?
A. 11.25 πin2
B. 29.57 πin2
C. 18.35 πin2
D. 20.25 πin2
Answer Explanation
We need to find the radius in order to find the area of the pizza.
Radius of pizza
The area of the pizza
But r=4.5
Thus, the area of the pizza is 20.25
in2.NOTE:
is used as is since values of pi may vary e.g. 3.14, 3.142, 22/7. Hence we use pi symbol to generalize. -
Q #5: A recipe calls for 5.5 teaspoons of vanilla. 1 teaspoon equals approximately 4.93 mL. Which of the following is the correct amount of vanilla in mL?
A. 10.2 mL
B. 12 mL
C. 7.43 mL
D. 27 mL
Answer Explanation
We need to find how many mL are in 5.5 teaspoons. We are told that 1 teaspoon is about 4.93 mL, which we interpret as follows:

Or

Since we are looking for mL, we use the second option.
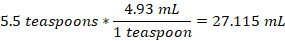
Thus, 5.5 teaspoons can hold approximately 27 mL.
-
Q #6: When the weights of the newborn babies are graphed, the distribution of weights is symmetric with the majority of weights centered around a single peak. Which of the following describes the shape of this distribution?
A. Uniform
B. Bimodal
C. Bell-shaped
D. Skewed right
Answer Explanation
The distribution of the weights of the newborn babies is symmetric meaning the mean, mode, and median are all equal. Thus, the bell-shape curve describes this kind of distribution of weights
-
Q #7: How may milliliters are there in 3.2 liters?
A. 0.32
B. 32
C. 3200
D. 320
Answer Explanation
We know that 1 L =1000 mL, which we use to convert between the two units. The conversion fractions of interconverting are:

And

Since we want to end up with millimeters, the second conversion is used in converting L to mL as:
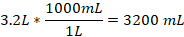
Thus, 3.2 L is equivalent to 3200 mL.
-
Q #8: The table below shows the student’s score at the end of the semester. Which of the following would best display the data? Subject Math Chemistry Biology Physics English Test scores 90 72 85 95 63
A. Stem and leaf plot
B. Line graph
C. Bar graph
D. Scatter plot
Answer Explanation
The best way to visualize the student’s score for each subject is to plot them using a bar graph.
-
Q #9: A class of 48 students has 22 boys and 26 girls. What is ratio of girls to boys in the class?
A. 26:11
B. 13:11
C. 13:22
D. 11:13
Answer Explanation
: a ratio can be thought of a fraction of the form a/b, where b is not equal to zero. In ratio form, to means per.
Now, the class has 26 girls and 22 boys. Thus, the ratio of girls to boys becomes:

The fraction above reduces into
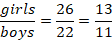
In ratio form, girls: boys=13:11
Thus, the ratio of girls to boys in a class of 48 students is 13 to 11.
-
Q #10: Which of the following statements is true about the graph?
A. The Chargers points per game decreased between seasons seven times between 1996 and 2015
B. The Chargers scored their lowest number of points per game in 2003-04 season
C. The Chargers scored their greatest number of points per game in the 2006-07 season
D. The Chargers points remained unchanged in the seasons 2012-13 and 2013-14.
Answer Explanation
Looking at the give curve, we analyze each statement as:
- For statement 1: the points per game decreased five times between 1996 and 2015. So, the statement is false.
- For statement 2: the lowest points scored per game was in 1998-99 season and not in 2003-04 season. So, the statement is false.
- For statement 3: 2008-09 was the season the chargers scored the greatest number of points per game. So, this statement is false.
- For statement 4: the two season which no change in the points were 2012-13 and 2013-14. So this is true according to given curve.

