A math teacher obtained the following scores from a class of 45 students. Which of the following is the best way to display the frequency of each day of the week? Test score 50-59 60-69 70-79 80-89 90-99 Number of students 10 4 9 20 2
A. Scatterplot
B. Pie graph
C. Line graph
D. Histogram
In order for the teacher to better visualize the test performance for his class, he needs to present the mark distribution in chart form. A better chart visualizer is the histogram, which will show the frequency of marks against range of test scores. A bar graph will not be used because the rectangles need to touch one another.
In a bar graph, the rectangles do not touch each other. Therefore, it will not be a good chart visualizer.
Therefore, the Correct Answer is D.
More Questions on TEAS 7 Math
-
Q #1: A bucket can hold 5000 mL. How many L can the bucket hold?
A. 500L
B. 5L
C. 50L
D. 0.05L
Answer Explanation
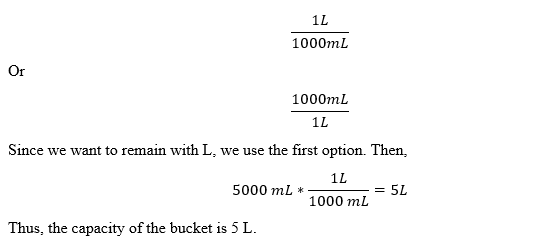
To change between L and mL, the following two options are used.
-
Q #2: An athlete runs 7 miles in 45 minutes and then changes their pace to run the next 3 miles in 15 minutes. Overall, what is the average time in minutes it takes the athlete to run 1 mile?
A. 9.5 minutes
B. 9 minutes
C. 6 minutes
D. 10minutes
Answer Explanation
to find the average time the athlete runs in 1 mile; we find total distance and total time the athlete takes in running.
Total distance run by athlete=7+3=10 miles
Total time=45+15 =60 minutes
The athlete runs 10 miles in 60 minutes. For the athlete to cover 1 mile, he will run for a time less than 60 minutes. Thus, in 1 mile, the athlete takes:
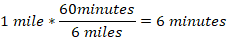
So, in 6 minutes, the athlete covers 1 mile.
-
Q #3: Which of the following relationships represents a negative correlation between two variables?
A. As a student’s class attendance decreases, the student’s overall grade remains the same
B. As the number of hours a person exercises decreases, the weight of that person remains unchanged
C. As the number of miles driven increases, the amount of the gasoline in the tank decreases
D. As the amount of water plant receives increases, the growth rate of the plant increase.
Answer Explanation
Correlation of two variables falls into:
Positive correlation: an increase in one variable causes another variable to increase
Negative correlation: an increase in one variable causes another one to decrease
No correlation: a change in one variable does not cause any response in another variable.
From the given choices
Option a is no correlation
Option b is a no correlation
Option c is a negative correlation
Option d is a positive correlation
-
Q #4: A sweater that normally sells for $95 is marked 30% off. Which of the following estimates the sale price of the sweater?
A. $67
B. $30
C. $22
D. $63
Answer Explanation
The selling price of the sweater is marked price less the mark off value.
Mark off value=mark off rate*original price
Mark of value=30% of $95
Mark of value=0.30*$95=$28.50
Now, find the selling price of the sweater
Selling price= marked price-mark off value

Thus, the sweater will be sold for 66.50 after applying a mark off of 30%. The selling price is about $67.
-
Q #5: A recipe calls for 1.5 teaspoons of vanilla. 1 teaspoon equals approximately 4.93 mL. Which of the following is the correct amount of vanilla in mL?
A. 6.33 mL
B. 12.325 mL
C. 7.395 mL
D. 0.797 mL
Answer Explanation
We are asked to find mL equivalent in 1.5 teaspoons. To carry out the operations, we utilize dimensional analysis to solve this problem as follows.
Converting between teaspoon and mL uses the following conversions:

Or

Since we want to remain with mL, use the second option and proceed as follows.
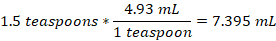
Thus, 1.5 teaspoons is equal to 7.395 mL
-
Q #6: A student performs the following estimations. 35+192 230 258+350 610 947+1032 1980 Based on these estimations, which of the following is the student’s estimate of 694+7618?
A. 8320
B. 8500
C. 8300
D. 8310
Answer Explanation
Here we need to find the actual values of the additions and see the trend the student will use to estimate the given problem. The exact sum is as follows
35+192
 227
227258+350=608
947+1032=1979
From the above calculations, it is evident that the student rounds up or down the ones place values. So, in the problem we need to approximate 694+7618.
694+7618=8312
We can approximate 8312 based on the provided choices is 8310.
-
Q #7: A farmer is planning for a growing season and want to know the trend in amount of rainfall in his area. He obtains rainfall falling in the first 5 months of the year as shown in the above table. Which of the following would best display the data? Month January February March April May Rainfall (mm) 20 6 14 28 34
A. Scatter plot
B. Pie chart
C. Line graph
D. Bar graph
Answer Explanation
Based rainfall falling for the first 5 months, a bar graph will give a great display for the farmer to decide when start planting. The horizontal scale will represent months of the year and vertical scale will present the amount of rainfall falling.
-
Q #8: A class of 40 students has 18 boys and 22 girls. What is ratio of girls to boys in the class?
A. 11:9
B. 20:9
C. 9:11
D. 20:11
Answer Explanation
A ratio is of the form a : b but can also be converted to a fraction of the form a/b, where b is not equal to zero. Besides, to in ration means per in fraction form.
In the class of 40 students, 22 are girls and 18 are boys. Thus, the ratio of girls to boys becomes:

The above fraction can be reduced further since 2 is a common factor in both 22 and 18. Thus
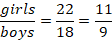
In ratio form, girls: boys=11:9
Thus, the ratio of girls to boys in a class of 40 students is 11 to 9.
-
Q #9: A child has collected 50 pennies, 45 nickels, 25 dimes, and 5 quarters. Which of the following charts accurately organizes the number of coins?
A. 1
B. 2
C. 3
D. 4
Answer Explanation
In this scenario, we use the given scale in the charts to find the number of each coin and selected the right number of coins the student collected.
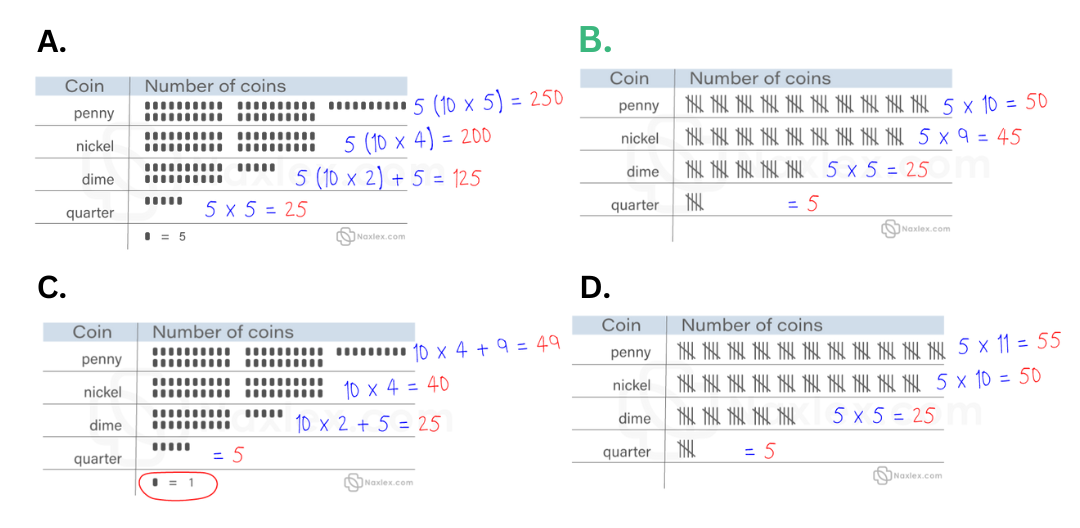
From the above evaluations, option two is the correct choice.
-
Q #10: Which of the following percentages is equivalent to the fraction below? 7/8
A. 875%
B. 0.875%
C. 8.75%
D. 87.5%
Answer Explanation
We are required to find the percent equivalent of the given fraction.
We multiply 7/8 by 100 to convert it to percent. You convert fraction to percent.

Thus 7/8 is equal to 87.5%.

