A teacher earns $730.00 per week before any tax deductions. The following taxes are deducted each week: $72.00 federal income tax, $35.00 state income tax, and $65.00 Social Security tax. How much will the teacher make in 4 weeks after taxes are deducted?
A. $2,250.00
B. $2,550.00
C. $2,400.00
D. $2,232.00
The net income is the salary of the teacher gets after deducting total taxes.
Weekly net income=weekly gross income-total tax
Total tax=federal income tax+state income tax+Social Security tax
Total tax=$(72.00+35.00+65.00)
Total tax=$172.00
Weekly net income=$(730.00-172.00)=$558.00
The net income the teacher gets in 4 weeks is what she gets in one week multiplied by 4

The teacher will earn a net income of $2,232.00 in 4 weeks after taxes are deducted.
Therefore, the Correct Answer is D.
More Questions on TEAS 7 Math
-
Q #1: 3(2x+5)=11x+5 Solve the equation above for x. Which of the following is correct?
A. 1
B. 2
C. -1
D. -2
Answer Explanation
We follow the order operations to solve for the unknown value of x.
3(2x+5)=11x+5
Open the bracket on the LHS by multiplying each term by 3
(3*2x)+(3*5)=11x+5
6x+15=11x+5
Subtract 15 from both sides
6x+15-15=11x+5-15
6x=11x-10
Subtract 11x on both sides
6x-11x=11x-11x-10
-5x=-10
Divide both sides by -5
-5x/-5=-10/-5
x= 2
Thus, the value of unknown value of x is 2.
-
Q #2: A teacher has asked all the students in the class which data visualizer he will use to show relationship between their scores and number of subjects. Which of the following is the best way to display the frequency of each day of the week?
A. Histogram
B. Scatterplot
C. Pie graph
D. Bar graph
Answer Explanation
Histograms are used to present frequency of data of one variable over the other. On the other hand, a bar graph is used to compare the two variables with the rectangles not touching one another as in histograms. Scatter plots are used to show the correlations between two variables. In this case, the teacher will be able to use scatter plot to establish the correlation between test scores and the subjects.
-
Q #3: A teacher earns $730.00 per week before any tax deductions. The following taxes are deducted each week: $72.00 federal income tax, $35.00 state income tax, and $65.00 Social Security tax. How much will the teacher make in 4 weeks after taxes are deducted?
A. $2,250.00
B. $2,550.00
C. $2,400.00
D. $2,232.00
Answer Explanation
The net income is the salary of the teacher gets after deducting total taxes.
Weekly net income=weekly gross income-total tax
Total tax=federal income tax+state income tax+Social Security tax
Total tax=$(72.00+35.00+65.00)
Total tax=$172.00
Weekly net income=$(730.00-172.00)=$558.00
The net income the teacher gets in 4 weeks is what she gets in one week multiplied by 4
The teacher will earn a net income of $2,232.00 in 4 weeks after taxes are deducted.
-
Q #4: A student performs the following estimations. 26+180210 115+391510 497+20242520 Based on these estimations, which of the following is the student’s estimate of 545+7501?
A. 8030
B. 8060
C. 8160
D. 8050
Answer Explanation
From the given estimations, we can find the exact sum after adding the given numbers and see the trend the student utilizes to find their estimates. The actual sum is as follows
26+180=
 206
206115+391=
 506
506497+2024=
 2521
2521From the above evaluation, the students round the exact sum to the nearest tens. So, in the problem we need to approximate 545+7501.
545+7501=8046
The exact sum is 8046 and the approximate value after rounding to the nearest tens is 8050.
-
Q #5: One gallon of cleaning solution requires 6 oz of ammonia. If the maintenance department needs 230 gallons of solution to clean all of the floors, how much ammonia is needed?
A. 1380 gallons
B. 6900 gallons
C. 1380 oz
D. 1400 oz
Answer Explanation
from the given data, one gallon of cleaning solution requires 6 oz of ammonia. The mathematical expression of this statement can be expressed in two ways:
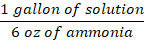
Or
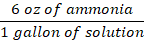
The question requires we find the amount of ammonia needed to make 230 gallons of the solution. So, we use the second option and proceed as follows:

From the above equation, gallon of solution will cancel, and oz of ammonia is left.
Therefore, the solution will require 1380 oz of ammonia.
-
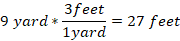
Q #6: How many feet are in 9 yards?
A. 45 ft
B. 18 ft
C. 36 ft
D. 27 ft
Answer Explanation
The interconversion of yards to feet utilizes the relationship 1 yard =3 feet. Then, 9 yards to ft becomes
 t
tThere, 9 yards is equal to 27 ft.
-
Q #7: A sweater that normally sells for $78 is marked 15% off. Which of the following estimates the sale price of the sweater?
A. $12
B. $66
C. $22
D. $69
Answer Explanation
we are to find the selling price of the sweater from the marked price and the discount. The marked price is given as
Discount=mark off rate*original price
Discount=15%*$78
Convert 15% into a fraction, which become 15/100=0.15. Then
Discount=0.15*$78=$11.70
The selling price of the sweater will be the original price less the discount or mark off value. Then,

Thus, the approximate selling price of the sweater is $66.
-
Q #8: A child has collected 250 pennies, 200 nickels, 125 dimes, and 25 quarters. Which of the following charts accurately organizes the number of coins?
A. A
B. B
C. C
D. D
Answer Explanation
In this scenario, we use the given chart and scale provided to find the number of each coin and select the right number of coins the student collected.
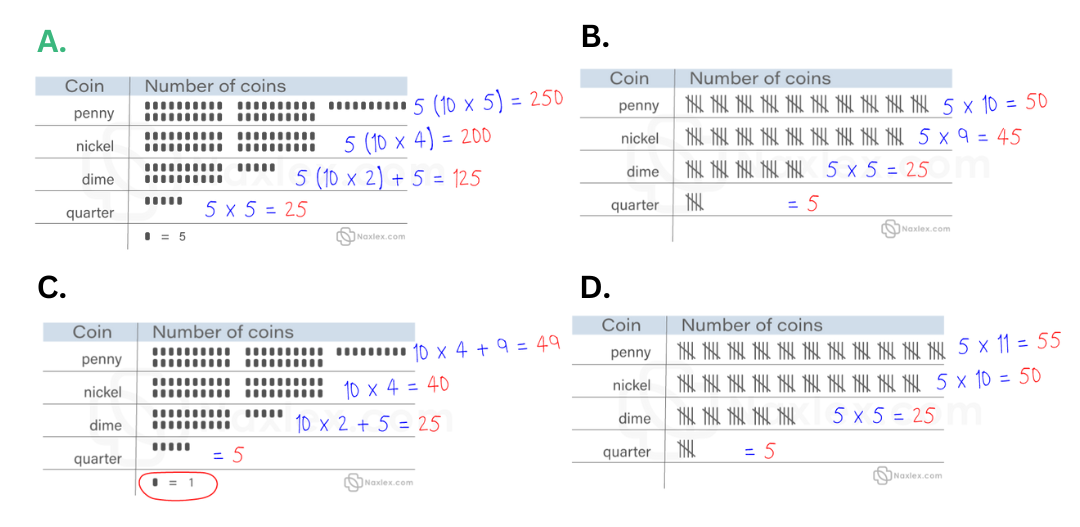
It is clear that the first choice if the correct answer. The child collected 250 pennies, 200 nickels, 125 dimes, and 25 quarters.
-
Q #9: The table below shows the student’s score at the end of the semester. Which of the following would best display the data? Subject Math Chemistry Biology Physics English Test scores 90 72 85 95 63
A. Stem and leaf plot
B. Line graph
C. Bar graph
D. Scatter plot
Answer Explanation
The best way to visualize the student’s score for each subject is to plot them using a bar graph.
-
Q #10: A student performs the following estimations. 35+192 230 258+350 610 947+1032 1980 Based on these estimations, which of the following is the student’s estimate of 694+7618?
A. 8320
B. 8500
C. 8300
D. 8310
Answer Explanation
Here we need to find the actual values of the additions and see the trend the student will use to estimate the given problem. The exact sum is as follows
35+192=227
258+350=608
947+1032=1979
From the above calculations, it is evident that the student rounds up or down the ones place values. So, in the problem we need to approximate 694+7618.
694+7618=8312
We can approximate 8312 based on the provided choices is 8310.

