Five friends are sharing a pizza. Two friend eats a quarter of the pizza. The other three friends equally divide the rest among themselves. What portion of the pizza did each of the other three friends receive?
A. 1/6
B. 1/3
C. ¼
D. 1/5
A whole pizza represents 1, and two friends eat ¼ of the pizza. The remaining fraction of pizza is:
Remaining amount = 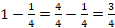
Thus, 3/4 of pizza is left for three friends to share equally.
Now, the other three friends will each get
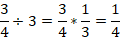
So, the other three friends will each get 1/4 of the pizza.
Therefore, the Correct Answer is C.
More Questions on TEAS 7 Math
-
Q #1: A large pizza has a diameter of 12 inches. Which of the following is the area of the pizza in terms of pi ()?
A. 24 πi n2
B. 48 π in2
C. 18π in2
D. 36 π in2
Answer Explanation
Before finding the area of the pizza, we need to find the radius of the pizza.
Find radius of the pizza in terms of diameter
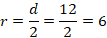
Next, find area of the pizza using the radius of 6 inches

Substituting r=6 in the equation of the area of a circle
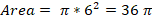
Thus, the pizza has an area of 36 π in2.
-
Q #2: 3.60*0.75 Simplify the expression above. Which of the following is correct?
A. 0.027
B. 27
C. 0.27
D. 2.7
Answer Explanation
To solve the equation this equation, we compute the multiplication of the two numbers using the calculator
3.60 * 0.75 = 2.7
-
Q #3: Which of the following statements is true about the following graph?
A. The Chargers points per game decreased between seasons five times between 1996 and 2015
B. The Chargers scored their lowest number of points per game in 1999-2000 season
C. The Chargers scored their greatest number of points per game in the 2002-03 season
D. None of the above
Answer Explanation
We analyze the given statement with the graph given as follows:
For option a: the points per game decreased five times between 1996 and 2015. So, the statement is true.
For option b: the lowest points scored per game was in 1998-99 season. So, the statement is false.
For option c: 2008-09 was the season the chargers scored the greatest number of points per game and not 2002-03 as claimed in the statement. So, this statement is not true.
-
Q #4: A math teacher obtained the following scores from a class of 45 students. Which of the following is the best way to display the frequency of each day of the week? Test score 50-59 60-69 70-79 80-89 90-99 Number of students 10 4 9 20 2
A. Scatterplot
B. Pie graph
C. Line graph
D. Histogram
Answer Explanation
In order for the teacher to better visualize the test performance for his class, he needs to present the mark distribution in chart form. A better chart visualizer is the histogram, which will show the frequency of marks against range of test scores. A bar graph will not be used because the rectangles need to touch one another.
In a bar graph, the rectangles do not touch each other. Therefore, it will not be a good chart visualizer.
-
Q #5: A couple dining at a restaurant receives a bill for $58.60. They wish to leave a 16% gratuity. Which of the following is the estimated gratuity?
A. $8.48
B. $6.40
C. $9.38
D. $7.00
Answer Explanation
In this problem, we need to find the amount of gratuity the couple will leave. The gratuity is 16% of the total bill. Before solving the problem, the following are terms and their meaning in percent problems:
- Is means equals
- Of means multiply
- What means unknown (variable)
If we let x be the amount of gratuity, then translating the given problem into a mathematical equation becomes:
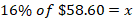
Now we evaluate the above equation noting that of means multiply.
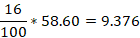
So, the value of x=9.376 and to the nearest cent, x=9.38
There, a couple will leave a gratuity of $9.38.
-
Q #6: How many yards are in 27 feet?
A. 3 yards
B. 18 yards
C. 6 yards
D. 9 yards
Answer Explanation
Here we convert between feet and yards. We know 1 yard =3 feet. Then, 27 feet to yards will be:
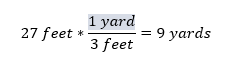
Thus, 9 yards is equal to 27 ft.
-
Q #7: The graph below represents the amount of rainfall in a particular state by month. Which of the following is the total rainfall for the first 5 months of the year?
A. 11 inches
B. 7.5 inches
C. 4.5 inches
D. 3.5 inches
Answer Explanation
The first five months of the year are January, February, March, April, and May. We use to graph to find the amount of rainfall in each month as follows:
In the month of January, rainfall was between o and 1, which is halfway. Therefore, rainfall in January is 0.5 inches
On February, rainfall was 1 inch and on March the rainfall was 2 inches.
On April, the rainfall amount was 4 inches while on month of May, the rainfall was about 3.5 inches. Therefore, total rainfall in the first 5 months was:
Total rainfall=0.5 inches+1 inches+ 2 inches+4 inches + 3.5 inches =11 inches
-
Q #8: One gallon of cleaning solution requires 10 oz of ammonia. If the maintenance department needs 51 gallons of solution to clean all of the floors, how much ammonia is needed?
A. 510 gallons
B. 51 gallons
C. 510 oz
D. 51 oz
Answer Explanation
We use given information to find how much ammonia is need to make the specified solution.
We are told, one gallon of cleaning solution requires 10 oz of ammonia. Expressing this mathematically yields two options:
\(\frac{10\ oz\ of\ ammonia}{1\ gallon\ of\ solution}\) or \(\frac{1\ gallon\ of\ solution}{10\ oz\ of\ ammonia}\)
Now we find how much ammonia is needed using option two.
\(51\ gallon\ of\ solution\ *\frac{10\ oz\ of\ ammonia}{1\ gallon\ of\ solution}\ =\ 510\ oz\ of\ ammonia\)
From the above equation, gallon of solution will cancel, and oz of ammonia is left.
Therefore, the solution will require 510 oz of ammonia.
-
Q #9: Which of the following relationships represents a negative correlation between two variables?
A. As a student’s class attendance decreases, the student’s overall grade remains the same
B. As the number of hours a person exercises decreases, the weight of that person remains unchanged
C. As the number of miles driven increases, the amount of the gasoline in the tank decreases
D. As the amount of water plant receives increases, the growth rate of the plant increase.
Answer Explanation
Correlation of two variables falls into:
Positive correlation: an increase in one variable causes another variable to increase
Negative correlation: an increase in one variable causes another one to decrease
No correlation: a change in one variable does not cause any response in another variable.
From the given choices
Option a is no correlation
Option b is a no correlation
Option c is a negative correlation
Option d is a positive correlation
-
Q #10: A farmer is planning for a growing season and want to know the trend in amount of rainfall in his area. He obtains rainfall falling in the first 5 months of the year as shown in the above table. Which of the following would best display the data? Month January February March April May Rainfall (mm) 20 6 14 28 34
A. Scatter plot
B. Pie chart
C. Line graph
D. Bar graph
Answer Explanation
Based rainfall falling for the first 5 months, a bar graph will give a great display for the farmer to decide when start planting. The horizontal scale will represent months of the year and vertical scale will present the amount of rainfall falling.

