Solve for x in the equation above.
A. x=rwy+z
B. x=rw(y-z)
C. x=y(z+rw)
D. x=rwy+z
We are asked to make x the subject of the formula.
First, we add z to both sides of the equation
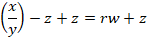

Multiply both sides by y
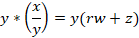

The above equation can be rearranged into

Thus, the formula for finding the value of x is y(z+rw).
Therefore, the Correct Answer is C.
More Questions on TEAS 7 Math
-
Q #1: Four friends are sharing a pizza. One friend eats half of the pizza. The other three friends equally divide the rest among themselves. What portion of the pizza did each of the other three friends receive?
A. 1/6
B. 1/3
C. ¼
D. 1/5
Answer Explanation
What fraction of the pizza the other three friends get is what is asked to find.
First, the pizza is whole, representing a value of 1. Then, one friend ate half of the pizza. Thun, the fraction of the pizza the friend gets is:
First friend eats =1/2 of 1=1/2
Remaining fraction of the pizza=1-1/2=1/2
Now, the three friends share ½ amongst themselves equally. Then, each friend gets
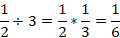
The three friends each gets 1/6 of the pizza.
-
Q #2: Which of the following is the total number of whole boxes that measure 2 ft * 2 ft * 2 ft that can be stored in a room that measures 9 ft * 9 ft * 9 ft, if the size of the boxes cannot be altered?
A. 125
B. 64
C. 92
D. 18
Answer Explanation
The number of boxes is determined by finding the volume of the room divided by the volume of the box.
Number of boxes
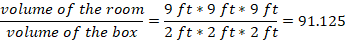
The approximate number of boxes that can be stored in the room is 92.
-
Q #3: There are 800 students enrolled in four allied health program at a local community college. The percent students in each program is displayed in the pie chart. Which of the following is the number of students enrolled in the respiratory care program?
A. 168
B. 144
C. 336
D. 152
Answer Explanation
We are asked to find the number of students enrolled in the respiratory care program using the percentages in the pie chart.
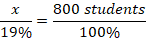
If we let x represent the number of students enrolled in the respiratory care program, we can set a proportion equation with number of students on the numerator and percentages on the denominator. The whole pie chart represents 100%, which is 800 students. Then, 19% will represent
We solve the value of x by cross-multiplying the equation above.
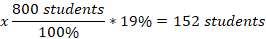
So, 152 students will enroll for a respiratory care program.
-
Q #4: A person weighed themselves at 180 lb. Three months later they weighed themselves at 160 lb. Which of the following is the percent of weight the person lost over 3 months? (Round to the nearest percent.)
A. 20%
B. 13%
C. 11%
D. 9%
Answer Explanation
The question requires us to find the percentage change in weight of a person.
First, we need to find the change in weight over the 3 months
Change in weight= 180-160=20 lb
Percent change in weight is change of original weight *100. Thus
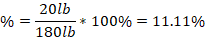
The percent change in weight is 11% to the nearest whole number.
-
Q #5: Kwame’s uncle is seventeen less than three times Kwame’s age. Which of the equations represents Kwame’s uncle’s age (u) as it relates to Kwame’s age (k)?
A. u=17-3k
B. k=3u-17
C. k=17-3u
D. u=3k-17
Answer Explanation
We are asked to find the Kwame’s uncle’s age in terms of Kwame’s age.
First, we need to find the age of Kwame, which is k. Then, we know that Kwame’s uncle’s age is three times that of Kwame less 17. Then,
Kwame’s uncle’s age, u = 3k-17.
Thus, the relation that relates Kwame’s uncle’s age to that of Kwame is u=3k-17.
-
Q #6: A teacher has asked all the students in the class which days of the week they get up after 8 a.m. which of the following is the best way to display the frequency for each day of the week?
A. Histogram
B. Pie graph
C. Scatter plot
D. Bar graph
Answer Explanation
The best way to display the frequency of each day of the week when students get up after 8 a.m. is by using a bar graph. Bar graphs are well-suited for representing categorical data, where each day of the week is a separate category, and the height of each bar corresponds to the count or frequency of students waking up late on that specific day.
Note: Histograms, on the other hand, are more appropriate for visualizing continuous or numerical data and are not ideal for categorical data like days of the week. Histograms are useful for understanding the distribution of data, identifying patterns, and assessing the shape of the data distribution, such as whether it's normally distributed, skewed, or has multiple modes.
As you can see below, the Histogram is used to depict a pattern/continuous/range data. While a bar graph does just fine even with discrete data.


-
Q #7: How many milliliters are there in 0.5 liters?
A. 5.000
B. 50
C. 500
D. 5
Answer Explanation
We use the relation 1 L=1000 mL to convert 0.5 L to mL as follows.
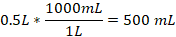
Thus, 0.5 L is 500 mL.
-
Q #8: -2/3, -0.7, -1.3, -4/3 Of the number listed above, which number is the greatest?
A. -2/3
B. -0.7
C. -1.3
D. -4/3
Answer Explanation
To find the greatest number from the given options, we first convert the decimal numbers into fractions.
-0.7 becomes 7/10
-1.3 becomes 13/10
Then, we find the LCM for the denominators of the given fractions. The LCM of 3 and 10 is 30. Now we can multiply each fraction with the LCM.
-2/3*30=-20
-7/10*30=-70
-13/10*30=-39
-4/3*30=-40
Comparing the obtained values from above, -20 is the greatest followed by -39, -40, -70 in that order. The fraction -2/3 gave a value of -20, which was the greatest value. Thus, -2/3 is the greatest value from the given option.
-
Q #9: To determine the cost of a pizza, the pizza parlor considers the diameter of the pizza, the number of toppings, and the amount of cheese. Which of the following is the dependent variable?
A. Amount of pizza
B. Dimeter of the pizza
C. Cost of the pizza
D. Number of toppings
Answer Explanation
We are asked to find the dependent variable from the given scenario. A dependent variable is one which varies with another variable. In this case, the cost of the pizza will change with the change in diameter of the pizza, number of toppings, and amount of cheese. In other words, the cost of the pizza depends on the three variables.
Therefore, cost is the dependent variable while the diameter of the pizza, number of toppings and amount of cheese are independent variables.
-
Q #10: Which of the following is the appropriate unit of a measure to express the weight of a spoon?
A. Liter
B. Milliliter
C. Gram
D. Kilogram
Answer Explanation
We required to find the units of finding the weight of a spoon. The mass is measured in kilogram and grams. Kilograms are used to measure the mass of heavier objects while grams for small and lighter objects.
Thus, gram is the appropriate unit for measuring weight of a spoon.

