The graph below represents the amount of rainfall in a particular state by month. Which of the following is the total rainfall for the months May, June, and July?
A. 9.0 inches
B. 8.4 inches
C. 7.5 inches
D. 10.5 inches
: We need to find the total rainfall for the months of May, June, and July using the given graph.
In the month of May, rainfall is between 3 and 4, which is halfway. Therefore, rainfall in May is 3.5 inches
On June, rainfall was 3 inch and on July the rainfall was 2.5 inches. Thus,
Total rainfall=3.5 inches+3 inches+ 2.5 inches=9.0 inches
Therefore, the Correct Answer is A.
More Questions on TEAS 7 Math
-
Q #1: Which of the following percentages is equivalent to the fraction below? 3/4
A. 57%
B. 7.5%
C. 65%
D. 75%
Answer Explanation
to convert fraction to percent, multiply the fraction with 100%. Therefore, the percent equivalent of 3/4 is
3/4*100%=75%
Thus, 3/4 is equal to 75%.
-
Q #2: Which of the following is the greatest value?
A. 43÷55
B. 5/7
C. 0.729
D. 73%
Answer Explanation
we are asked to find the largest value from the options given. To solve this problem, we need to convert all the given values into fraction. Then find the least common denominator for all fractions, which we will use to multiply each fraction and make a comparison.
43÷
 55=43/55
5/7
0.729=729/1000
73%=73/100
Now, we need to find the least common denominator of 55, 7, 1000, and 100, which is 77000. We multiply each fraction by 77000 as follows:
43/55*77000=60200
5/7*77000=55000
729/1000*77000=56133
73/100*77000=56210
From the calculated values, it can be noted that 43/55 is the greatest value among the given options.
-
Q #3: A teacher earns $730.00 per week before any tax deductions. The following taxes are deducted each week: $72.00 federal income tax, $35.00 state income tax, and $65.00 Social Security tax. How much will the teacher make in 4 weeks after taxes are deducted?
A. $2,250.00
B. $2,550.00
C. $2,400.00
D. $2,232.00
Answer Explanation
The net income is the salary of the teacher gets after deducting total taxes.
Weekly net income=weekly gross income-total tax
Total tax=federal income tax+state income tax+Social Security tax
Total tax=$(72.00+35.00+65.00)
Total tax=$172.00
Weekly net income=$(730.00-172.00)=$558.00
The net income the teacher gets in 4 weeks is what she gets in one week multiplied by 4

The teacher will earn a net income of $2,232.00 in 4 weeks after taxes are deducted.
-
Q #4: How many feet are in 9 yards?
A. 45 ft
B. 18 ft
C. 36 ft
D. 27 ft
Answer Explanation
The interconversion of yards to feet utilizes the relationship 1 yard =3 feet. Then, 9 yards to ft becomes
 t
tThere, 9 yards is equal to 27 ft.
-
Q #5: An athlete runs 5 miles in 25 minutes and then changes their pace to run the next 3 miles in 15 minutes. Overall, what is the average time in minutes it takes the athlete to run 1 mile?
A. 7 minutes
B. 5 minutes
C. 6.5 minutes
D. 8.5 minutes
Answer Explanation
to find the average time the athlete runs in 1 mile, find total time divided by total distance covered in the two runs.
Total distance=5+3=8 miles
Total time=25+15=40 minutes
We now know that the athlete runs 8 miles in 40 minutes, so the time the athlete will run in 1 mile will be:
In 5 minutes, the athlete runs 1 mile.
-
Q #6: Which of the following relationships represents a no correlation between two variables?
A. As a student’s class attendance decreases, the student’s overall grade remains the same
B. As the number of hours a person exercises decreases, the weight of that person increases
C. As the number of miles driven increases, the amount of the gasoline in the tank decreases
D. As the amount of water plant receives increases, the growth rate of the plant increase.
Answer Explanation
Correlation of two variables falls into:
Positive correlation: an increase in one variable causes another variable to increase
Negative correlation: an increase in one variable causes another one to decrease
No correlation: a change in one variable does not cause any response in another variable.
From the given choices
Option a is no correlation
Option b is a negative correlation
Option c is a negative correlation
Option d is a positive correlation
Thus, the correct statement is a.
-
Q #7: A student performs the following estimations. 26+180210 115+391510 497+20242520 Based on these estimations, which of the following is the student’s estimate of 545+7501?
A. 8030
B. 8060
C. 8160
D. 8050
Answer Explanation
From the given estimations, we can find the exact sum after adding the given numbers and see the trend the student utilizes to find their estimates. The actual sum is as follows
26+180=
 206
206115+391=
 506
506497+2024=
 2521
2521From the above evaluation, the students round the exact sum to the nearest tens. So, in the problem we need to approximate 545+7501.
545+7501=8046
The exact sum is 8046 and the approximate value after rounding to the nearest tens is 8050.
-
Q #8: The graph below represents the amount of rainfall in a particular state by month. Which of the following is the total rainfall for the months May, June, and July?
A. 9.0 inches
B. 8.4 inches
C. 7.5 inches
D. 10.5 inches
Answer Explanation
: We need to find the total rainfall for the months of May, June, and July using the given graph.
In the month of May, rainfall is between 3 and 4, which is halfway. Therefore, rainfall in May is 3.5 inches
On June, rainfall was 3 inch and on July the rainfall was 2.5 inches. Thus,
Total rainfall=3.5 inches+3 inches+ 2.5 inches=9.0 inches
-
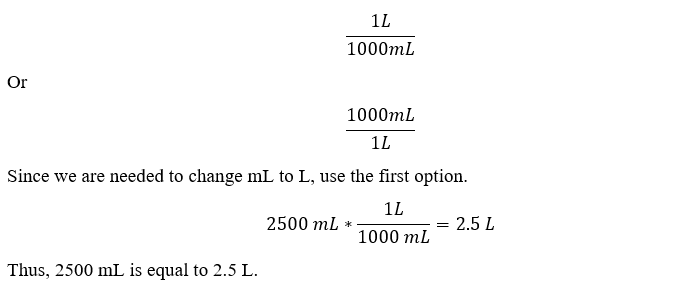
Q #9: A bucket can hold 2500 mL. How many L can the bucket hold?
A. 0.25 mL
B. 25 mL
C. 2.5 L
D. 250 L
Answer Explanation
Explanation: We know that 1 L=1000 mL and to change between L and mL we use the following two options
-
Q #10: Which of the following statements is true about the graph?
A. The Chargers points per game decreased between seasons seven times between 1996 and 2015
B. The Chargers scored their lowest number of points per game in 2003-04 season
C. The Chargers scored their greatest number of points per game in the 2006-07 season
D. The Chargers points remained unchanged in the seasons 2012-13 and 2013-14.
Answer Explanation
Looking at the give curve, we analyze each statement as:
- For statement 1: the points per game decreased five times between 1996 and 2015. So, the statement is false.
- For statement 2: the lowest points scored per game was in 1998-99 season and not in 2003-04 season. So, the statement is false.
- For statement 3: 2008-09 was the season the chargers scored the greatest number of points per game. So, this statement is false.
- For statement 4: the two season which no change in the points were 2012-13 and 2013-14. So this is true according to given curve.


