2(4x+3)=7x+5 Solve the equation above for x. Which of the following is correct?
A. 1
B. 2
C. -1
D. 11
we follow the order operations to solve for the unknown value of x.
2(4x+3)=7x+5
Open the bracket on the LHS by multiplying each term by 2
(2*4x)+(2*3)=7x+5
8x+6=7x+5
Subtract 6 from both sides
8x+6-6=7x+5-6
8x=7x-1
Subtract 7x on both sides
8x-7x=7x-7x-1
X=-1
Thus, the value of unknown value of x is -1.
Therefore, the Correct Answer is C.
More Questions on TEAS 7 Math
-
Q #1: A large pizza has a diameter of 16 inches. Which of the following is the area of the pizza in terms of pi (π)?
A. 16 πin2
B. 64 πin2
C. 32πin2
D. 256 πin2
Answer Explanation
We are told to find the area of the pizza given its diameter. The pizza is in circular form, and its area is found as:

However, we are not given r, which is the radius of the circle. But we can find it from the given diameter as
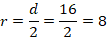
Substituting r=8 in the equation of the area of a circle
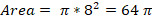
Thus, the area of the pizza is 64
 in2.
in2.NOTE:
 (Pi) remains as a symbol because values of Pi can vary from 22/7 to 3.1415 to 3.14 and so forth.
 -
Q #2: Which of the following is the weight of the cargo in a truck if 1/3 of the cargo weighs 516 pounds (lb)?
A. 172 lb
B. 1032 lb
C. 1548 lb
D. 688 lb
Answer Explanation
In this problem, we assume the truck carries a whole cargo. Thus, total weight is 516 lb divided by 1/3. Thus,

We change the division sign to product and multiply 516 by reciprocal of 1/3. Then,
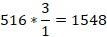
The weight of the cargo will be 1548 lbs.
-
Q #3: Five less than twice a number Which of the following translates the phrase above into a mathematical expression?
A. 5x-2
B. 2-5x
C. 5-2x
D. 2x-5
Answer Explanation
we need to form a mathematical expression from the given word problem.
Let the number be x.
Twice a number=2x
Five less than twice a number=2x-5
So the mathematical express from the word problem is 2x-5

