A recipe calls for 2.5 teaspoons of vanilla, 1 teaspoon equals approximately 4.93 mL. Which of the following is the correct amount of vanilla in mL?
A. 12.325 mL
B. 5.32 mL
C. 7.43 mL
D. 0.507 mL
We are given that 1 teaspoon=4.93 mL, we can interpret it as:

Or

Since we are to find the amount in mL, we look for an option that will cancel teaspoon and remain with mL. The second option is the required conversion, and we proceed as follows:
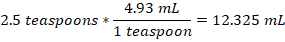
Therefore, 2.5 teaspoons hold about 12.325 mL.
Therefore, the Correct Answer is A.
More Questions on TEAS 7 Math
-
Q #1: A farmer needs to buy fertilizer for his farmland. The instructions on the bag of the fertilizer say 49.5 pounds of fertilizer is needed for 1 acre of land. The farmer buys 2,000 pounds of fertilizer. Which of the following is the approximate number of acres he can cover with the fertilizer he bought?
A. 40
B. 120
C. 300
D. 1000
Answer Explanation
From the given problem,
49.5 pounds of fertilizer is needed to farm 1 acre of land. This can be interpreted as:

Or

Now we are needed to find the acres of land that will be farmed using 2000 pounds of fertilizers. To solve this, we use the second option as follows:

2000 pounds of fertilizers can farm approximately 40 acres of land.
-
Q #2: Which of the following is the value of x in the equation below? 4x- 3- 5x=24
A. -27
B. -6
C. 3
D. 21
Answer Explanation
to solve for x, we order like terms together and proceed as follows:
4x-3-5x=24
Add 3 to both sides of the equation
4x-3+3-5x=24+3
4x+3-3-5x=27
4x-5x=27
-x=27
Divide both sides by -1
-x/-1=27/-1
x= -27
Thus, the unknown value of x is -27
-
Q #3: A teacher has asked all the students in the class which days of the week they get up after 8 a.m. Which of the following is the best way to display the frequency for each day of the week?
A. Pie graph
B. Bar graph
C. Histogram
D. Scatterplot
Answer Explanation
The best way to display the frequency of each day of the week when students get up after 8 a.m. is by using a bar graph. Bar graphs are well-suited for representing categorical data, where each day of the week is a separate category, and the height of each bar corresponds to the count or frequency of students waking up late on that specific day.
Note: Histograms, on the other hand, are more appropriate for visualizing continuous or numerical data and are not ideal for categorical data like days of the week. Histograms are useful for understanding the distribution of data, identifying patterns, and assessing the shape of the data distribution, such as whether it's normally distributed, skewed, or has multiple modes.
As you can see below, the Histogram is used to depict a pattern/continuous data. While a bar graph does just fine even with discrete data.


