/

A teacher has asked all the students in the class which days of the week they get up after 8 a.m. Which of the following is the best way to display the frequency for each day of the week?

A. Pie graph

B. Bar graph

C. Histogram

D. Scatterplot

Answer Explanation:

The best way to display the frequency of each day of the week when students get up after 8 a.m. is by using a bar graph. Bar graphs are well-suited for representing categorical data, where each day of the week is a separate category, and the height of each bar corresponds to the count or frequency of students waking up late on that specific day.

Note: Histograms, on the other hand, are more appropriate for visualizing continuous or numerical data and are not ideal for categorical data like days of the week. Histograms are useful for understanding the distribution of data, identifying patterns, and assessing the shape of the data distribution, such as whether it's normally distributed, skewed, or has multiple modes.

As you can see below, the Histogram is used to depict a pattern/continuous data. While a bar graph does just fine even with discrete data.
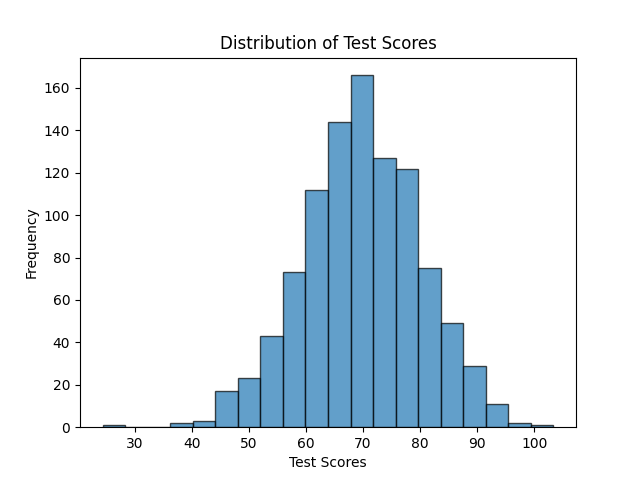
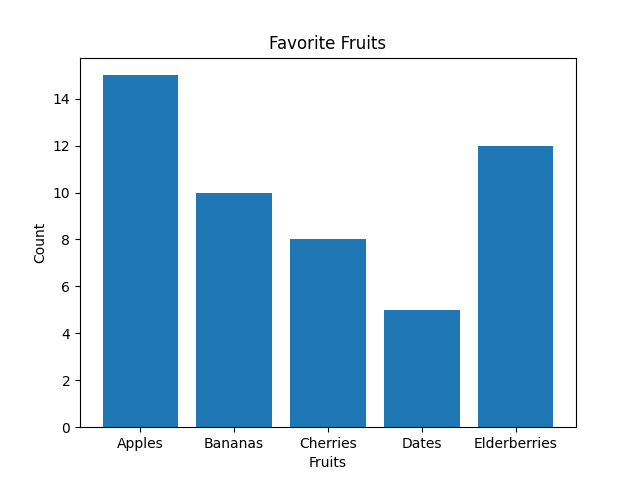
Therefore, the Correct Answer is B.

More Questions on TEAS 7 Math

  • Q #1: An athlete can run 6 miles in 51 minutes. At this rate, how many miles could the athlete run in 90 minutes?

    A. 15 miles

    B. 11.5 miles

    C. 45 miles

    D. 10.6 miles

    Answer Explanation

    Here, the athlete runs 6 miles in 51 minutes, which can be expressed as:

    Now, in 90 minutes, the athlete will cover about

    Therefore, the athlete runs about 10.6 miles in 90 minutes.

  • Q #2: To rent tablecloth from a rental vendor, there is an initial charge of $40. There is an additional charge of $5 per circular tablecloth (c) and $3.50 per rectangular tablecloth (r). Which of the following represents the total cost (T) to rent tablecloths?

    A. 5r + 3.5c - 40 = T

    B. 5c + 3.5r + 40 = T

    C. 5c + 3.5r - 40 = T

    D. 5r + 3.5c + 40 = T

    Answer Explanation

     From the given scenario:

    Initial charge is $40

    Additional charge per circular cloth=$5c

    Additional charge per rectangular cloth=$3.50r

    Total cost = additional charge per circular rectangular cloths + Initial charge

    Total cost, T = 5c + 3.5r + 40

  • Q #3: A pudding recipe for 50 people calls for 4 cups of sugar. Each bag of sugar contains 6 cups. How many bags of sugar will be needed to make this recipe for 300 people?

    A. 8 bags

    B. 13 bags

    C. 4 bags

    D. 24 bags

    Answer Explanation

    We need to perform a series of numerical dimensional analysis to find the number of bags sugar needed for 300 people.

    We are told that 50 people need 4 cups of sugar. This can be interpretated as:

    Or

    Also, one bag of sugar contains 6 cups. This can also be presented as:

    Or

    We use the second option relating number of people and cups, and second option relating cups of sugar and bag of sugar to find for number of bags of sugar needed for 300 people.


    Therefore, 300 people will need 4 bags of sugar.