As a person climbing a mountain increases walking speed, the rate of calories burned, height traveled, and energy expended also increase. Which of the following is the independent variable?
A. Walking speed
B. Energy
C. Calories
D. Height
An independent variable is a change that when modified brings a change in other variables. In this case, the person increases his climbing rate, calories burned, distance traveled and energy used increases. Therefore, the walking speed is the independent variable while other variables are dependent.
Therefore, the Correct Answer is A.
More Questions on TEAS 7 Math
-
Q #1: An athlete runs 7 miles in 45 minutes and then changes their pace to run the next 3 miles in 15 minutes. Overall, what is the average time in minutes it takes the athlete to run 1 mile?
A. 9.5 minutes
B. 9 minutes
C. 6 minutes
D. 10minutes
Answer Explanation
to find the average time the athlete runs in 1 mile; we find total distance and total time the athlete takes in running.
Total distance run by athlete=7+3=10 miles
Total time=45+15 =60 minutes
The athlete runs 10 miles in 60 minutes. For the athlete to cover 1 mile, he will run for a time less than 60 minutes. Thus, in 1 mile, the athlete takes:
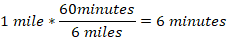
So, in 6 minutes, the athlete covers 1 mile.
-
Q #2: If a box of 45 syringes costs $720.00, which of the following is the cost of five syringes?
A. $75.00
B. $66.00
C. $82.00
D. $80.00
Answer Explanation
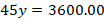
From the cost of 45 syringes, we are required to find the cost of 5 syringes. We set up a proportion equation by letting the cost of 5 syringes to y. Besides, we let the cost to be numerator and number of syringes to be denominator as follows.

Solve the value of y by cross products

Divide both sides by 45
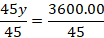

Therefore, 5 syringes will cost $80.00.
-
Q #3: A math teacher obtained the following scores from a class of 45 students. Which of the following is the best way to display the frequency of each day of the week? Test score 50-59 60-69 70-79 80-89 90-99 Number of students 10 4 9 20 2
A. Scatterplot
B. Pie graph
C. Line graph
D. Histogram
Answer Explanation
In order for the teacher to better visualize the test performance for his class, he needs to present the mark distribution in chart form. A better chart visualizer is the histogram, which will show the frequency of marks against range of test scores. A bar graph will not be used because the rectangles need to touch one another.
In a bar graph, the rectangles do not touch each other. Therefore, it will not be a good chart visualizer.

