The data below represents students’ test scores. Which of the following is the median of the set data? 24, 35, 18, 19, 22, 35, 16, 12, 26, 12, 23
A. 18
B. 22
C. 23
D. 19
The median of a data set is found in two ways:
For an odd data set, the median fall in the (N+1)/2 th position.
For an even data set, the median is the average of the element in the (N/2)th and (N+1)/2 th positions.
To find the median of the given data set, we need to arrange the elements from the smallest to the largest as follows:
12, 12, 16, 18, 19, 22, 23, 24, 26, 35, 35
There are 11 elements in the data set. 11 is an odd number and the median fall in the (N+1)/2 th position.
Median =(11+1)/2=12/2=6 th position.
From the organized data, the element in the 6th position is 22, which is the required median for the data set.
Therefore, the Correct Answer is B.
More Questions on TEAS 7 Math
-
Q #1: When the marks of a science test are graphed, the distribution of markss is symmetric with the majority of weights centered around a single peak. Which of the following describes the shape of this distribution?
A. Uniform
B. Skewed right
C. Bell-shaped
D. Bimodal
Answer Explanation
In a bell-shaped curve, the data distribution is symmetric around a single peak. The centering of data around a single peak means the mean, mode and median of the test are all equal to each other.
-
Q #2: A class of 40 students has 18 boys and 22 girls. What is ratio of girls to boys in the class?
A. 11:9
B. 20:9
C. 9:11
D. 20:11
Answer Explanation
A ratio is of the form a : b but can also be converted to a fraction of the form a/b, where b is not equal to zero. Besides, to in ration means per in fraction form.
In the class of 40 students, 22 are girls and 18 are boys. Thus, the ratio of girls to boys becomes:

The above fraction can be reduced further since 2 is a common factor in both 22 and 18. Thus
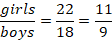
In ratio form, girls: boys=11:9
Thus, the ratio of girls to boys in a class of 40 students is 11 to 9.
-
Q #3: A couple dining at a restaurant receives a bill for $58.60. They wish to leave a 16% gratuity. Which of the following is the estimated gratuity?
A. $8.48
B. $6.40
C. $9.38
D. $7.00
Answer Explanation
In this problem, we need to find the amount of gratuity the couple will leave. The gratuity is 16% of the total bill. Before solving the problem, the following are terms and their meaning in percent problems:
- Is means equals
- Of means multiply
- What means unknown (variable)
If we let x be the amount of gratuity, then translating the given problem into a mathematical equation becomes:
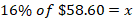
Now we evaluate the above equation noting that of means multiply.
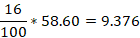
So, the value of x=9.376 and to the nearest cent, x=9.38
There, a couple will leave a gratuity of $9.38.

