The table below shows the student’s score at the end of the semester. Which of the following would best display the data? Subject Math Chemistry Biology Physics English Test scores 90 72 85 95 63
A. Stem and leaf plot
B. Line graph
C. Bar graph
D. Scatter plot
The best way to visualize the student’s score for each subject is to plot them using a bar graph.
Therefore, the Correct Answer is C.
More Questions on TEAS 7 Math
-
Q #1: "Twelve less than thrice a number." Which of the following translates the phrase above into a mathematical expression?
A. 3x-12
B. 12-3x
C. 3-12x
D. 12x-3
Answer Explanation
We convert the given word problem into a mathematical expression.
Let the number be x.
Thrice a number = 3x
Twelve less than thrice a number = 3x-12
Thus, the required mathematical expression is 3x-12
-
Q #2: Which of the following is the length of the unknown leg of a right triangle that has one leg length of 9 feet and a hypotenuse of 19 feet? (Round to the nearest tenth.)
A. 16.7 feet
B. 16.0 feet
C. 17.4 feet
D. 8.4 feet
Answer Explanation
The length of the unknown side of the rectangle can be found by using the Pythagoras theorem. Letting the unknown side to be x, the labelled rectangle becomes: The unknown length of the triangle is about 16.7 feet.
The length of the unknown side of the rectangle can be found by using the Pythagoras theorem. Letting the unknown side to be x, the labelled rectangle becomes:
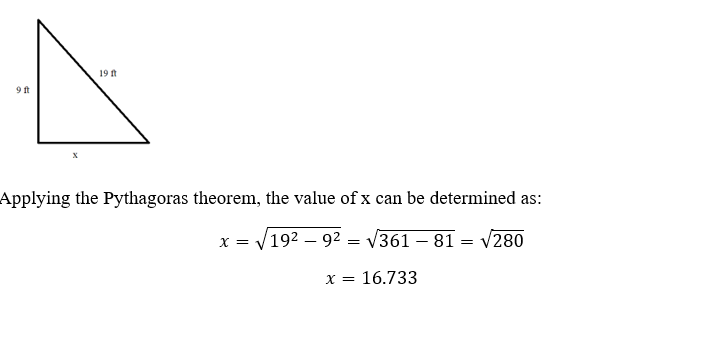
The unknown length of the triangle is about 16.7 feet.
-
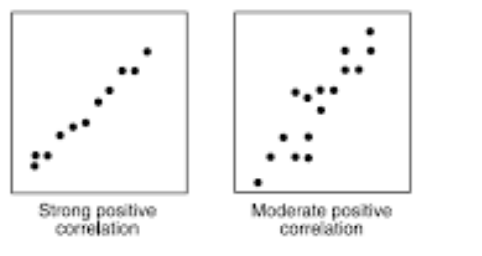
Q #3: The scatter plot below shows the relationship between the student’s exam scores and the students’ heights. Which of the following types of correlation is shown on the scatter plot?
A. Positive
B. Positive and negative
C. Negative
D. No correlation
Answer Explanation
correlations fall into positive, negative, and no correlation. A positive correlation shows that an increase in one variable increase results in an increase on the other variable increases as shown.
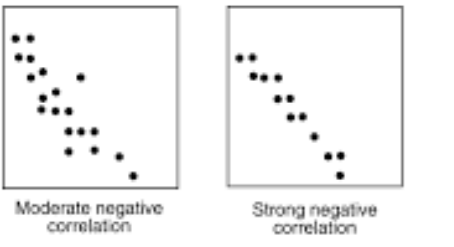
A negative correlation scatter plot shows that an increase in one variable results in a decrease on the other one.
The no-correlation scatter plot demonstrates that there is no response between variables. A change in one variable has no effect on the other variable.
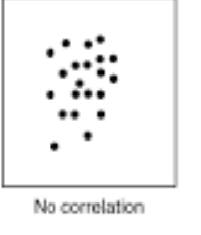
Looking at the provided scatter plot, the heights of the students does not have any relationship on the students’ scores. Thus, the type of correlation is no correlation.

