/

Which of the following is 31% of 426?

A. 425.69

B. 132.06

C. 13.7

D. 0.07

Answer Explanation:

First convert 31% to a decimal before working on the problem

31%=31/100=0.31

Thus, 31% of 426=0.31*426=132.06

Therefore, the Correct Answer is B.

More Questions on TEAS 7 Math

  • Q #1: Which of the following is the correct simplification of the expression below? 12 ÷ 3 * 4 - 1 + 23

    A. 6

    B. 21

    C. 38

    D. 23

    Answer Explanation

    Use the order of operations to solve the given equation. The acronym PEDMAS will help us to solve the given problem.

    P- Parenthesis

    E-Exponents

    D-Divide

    M-Multiply

    A-Add

    S-Subtract

    From the given equation start with solving :-

    12 ÷3 * 4 - 1 + 23

    Next, carry out division 12÷3=4

    4*4-1+23

    Multiply is 4*4=16

    16-1+23

    Add or subtract can be conducted in any order. From left to right, we subtract followed by addition

    Subtract 16-1=15

    15+23

    The last step is to add 15+23

    15+23=38

    Thus, the answer to the given equation is 38.

  • Q #2: A homeowner has hired two people to mow his lawn. If person A is able to mow the lawn in 2 hr by herself and person B is able to mow in lawn in 3 hr by himself. Which of the following is the amount of time it would take for both person A and B to mow the lawn together?

    A. 5 hours

    B. 2.5 hours

    C. 1.2 hours

    D. 1 hours

    Answer Explanation

    We know that the two people work on the same work but the time to complete the work differs. Thus, the rate of doing the work for each person is as follows:

    Rate of work for person A = 1 /2 work per hr

    Rate of work for person B=1/3 work per hour

    If person A and B work together, the time of doing the same work will be less than the fastest person A. Thus, we combine the two rates of A and B

    We have 1 work and time to complete by both A and B becomes

  • Q #3: A teacher asked all the students in the class which days of the week they get up after 8 a.m. Which of the following is the best way to display the frequency for each day of the week?

    A. Histogram

    B. Pie graph

    C. Bar graph

    D. Scatter plot

    Answer Explanation

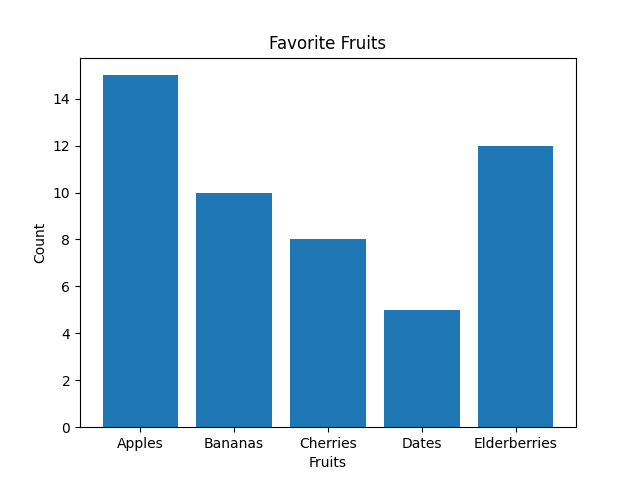
    The best way to display the frequency of each day of the week when students get up after 8 a.m. is by using a bar graph. Bar graphs are well-suited for representing categorical data, where each day of the week is a separate category, and the height of each bar corresponds to the count or frequency of students waking up late on that specific day.

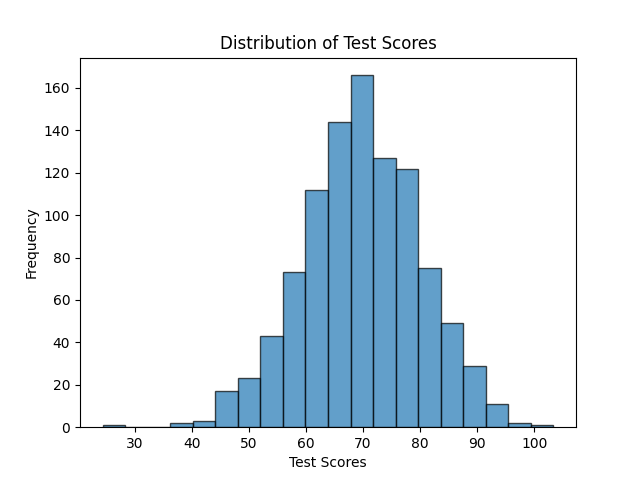
    Note: Histograms, on the other hand, are more appropriate for visualizing continuous or numerical data and are not ideal for categorical data like days of the week. Histograms are useful for understanding the distribution of data, identifying patterns, and assessing the shape of the data distribution, such as whether it's normally distributed, skewed, or has multiple modes.

    As you can see below, the Histogram is used to depict a pattern/continuous/range data. While a bar graph does just fine even with discrete data.