Which of the following is the greatest value?
A. 34÷96
B. 3/8
C. 0.372
D. 37%
we are asked to find the largest value from the options given. To solve this problem, we need to convert all the given values into fraction. Then find the least common denominator for all fractions, which we will use to multiply each fraction and make a comparison.
34÷96=
3/8=3/8
0.372=372/1000
37%=37/100
Now, we need to find the least common denominator of 48, 8, 1000, and 100, which is 6000. We multiply each fraction by 6000 as follows:
17/48*6000=2125
3/8*6000=2250
372/1000*6000=2232
37/100*6000=2220
From the above calculations, arranging the fraction from the largest to the smallest in order is: 3/8, 372/1000,37/100, and 17/48. Thus, the greatest value is 3/8.
Therefore, the Correct Answer is B.
More Questions on TEAS 7 Math
-
Q #1: How many feet are in 6 yards?
A. 9ft
B. 18 ft
C. 36 ft
D. 2 ft
Answer Explanation
here we use the US customary system to convert between yards and feet. We use the conversion 1 yard =3 feet. Then, 6 yards to ft is found as
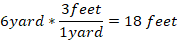
Thus, 6 yards is equal to 18 ft.
-
Q #2: Four friends are sharing a pizza. One friend eats half of the pizza. The other three friends equally divide the rest among themselves. What portion of the pizza did each of the other three friends receive?
A. 1/6
B. 1/3
C. ¼
D. 1/5
Answer Explanation
we are needed to find the portion of pizza shared by 3 three friends. We treat the whole pizza as 1. Now, 1 friend eats half of the whole pizza. Thus,
One friend=1/2 of 1=1/2*1=1/2
Remaining amount=1-1/2=2/2-1/2=1/2
Thus, ½ of pizza is left for three friends to share among themselves. Then, each friend will get
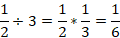
So, the other three friends will each get 1/6 of the pizza.
-
Q #3: A large pizza has a diameter of 16 inches. Which of the following is the area of the pizza in terms of pi (π)?
A. 16 πin2
B. 64 πin2
C. 32πin2
D. 256 πin2
Answer Explanation
We are told to find the area of the pizza given its diameter. The pizza is in circular form, and its area is found as:

However, we are not given r, which is the radius of the circle. But we can find it from the given diameter as
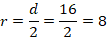
Substituting r=8 in the equation of the area of a circle
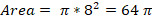
Thus, the area of the pizza is 64
 in2.
in2.NOTE:
 (Pi) remains as a symbol because values of Pi can vary from 22/7 to 3.1415 to 3.14 and so forth.

