Which of the following is the value of x in the equation below
A. x= -4 or x=2
B. x= -2 or x=3
C. x =-2 or x= 4
D. x= -2 or x= 1
we find the value of x by applying the absolute conditions to the given equation.
First, add 2 to both sides of equation
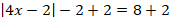


The absolute conditions are:
If  , a>0, then u=a or u=-a
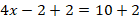
In this case a=10, which is greater 0.
The first condition becomes

Add 2 to both sides of the equation

Divide both sides by 4


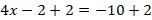
The second condition becomes

Add 2 to both sides of the equation

Divide both sides by 4


Then, the value of x is 3 or -2.
Therefore, the Correct Answer is B.
More Questions on TEAS 7 Math
-
Q #1: Japheth’s uncle is 10 less than three times Japheth’s age. Which of the equations represents Japheth’s uncle’s age (u) as it relates to Japheth’s age (k)?
A. u=10-3k
B. u=3k-10
C. k=3u-10
D. k=10-3u
Answer Explanation
We are asked to determine Japheth’s uncle’s age relating to Japheth’s age.
First, express Japheth’s uncle’s age in terms of Japheth’s age as follows
Japheth’s age=k
Japheth’s uncle’s age, u = 3k-10.
Thus, the relationship between Japheth’s uncle’s age to that of Japheth is u=3k-10.
-
Q #2: Which of the following is the total number of whole boxes that measure 4 ft * 4 ft * 4 ft that can be stored in a room that measures 11.5 ft * 11.5 ft * 11.5 ft, if the size of the boxes cannot be altered?
A. 10
B. 24
C. 20
D. 18
Answer Explanation
The number of boxes is determined by volume of the room divided by volume of one box.
Number of boxes

Therefore, about 24 boxes can be stacked in the room.
-
Q #3: There are 1200 students enrolled in four allied health programs at a local community college. The percent students in each program are displayed in the pie chart. Which of the following is the number of students enrolled in the radiologic technology program?
A. 216
B. 504
C. 228
D. 252
Answer Explanation
We are asked to find the number of students enrolled in the radiologic program using the information provided on the pie chart.
If we let x represent the number of students enrolled in the radiologic program, we set a proportion equation with number of students on the numerator and percentages on the denominator.
Total percent in the pie chart adds to 100%, which equals 1200 students. Then, 21% will represent
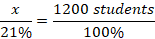
We solve the value of x by cross-multiplying the equation above.
Therefore, 252 students will enroll for a radiologic program.

