Which of the following values is the greatest?
A. 7/3
B. 5.2
C. 13/3
D. 5.15
The initial step is to convert the decimal numbers into fractions.
5.2 becomes 52/10
5.15 becomes 515/100
Next, find the least common denominator of 3, 10, and 100, which is 300. We use this value and multiply each fraction.
7/3*300=700
52/10*300=1560
13/3*300=1300
515/100*300=1545
From the above, 1560 is the greatest value which corresponds to 52/10. Thus, 5.2 is the greatest value of all the choices given.
Therefore, the Correct Answer is B.
More Questions on TEAS 7 Math
-
Q #1: The graph below represents the amount of rainfall in a particular state by month. Which of the following is the total rainfall for the first 5 months of the year?
A. 11 inches
B. 7.5 inches
C. 4.5 inches
D. 3.5 inches
Answer Explanation
The first five months of the year are January, February, March, April, and May. We use to graph to find the amount of rainfall in each month as follows:
In the month of January, rainfall was between o and 1, which is halfway. Therefore, rainfall in January is 0.5 inches
On February, rainfall was 1 inch and on March the rainfall was 2 inches.
On April, the rainfall amount was 4 inches while on month of May, the rainfall was about 3.5 inches. Therefore, total rainfall in the first 5 months was:
Total rainfall=0.5 inches+1 inches+ 2 inches+4 inches + 3.5 inches =11 inches
-
Q #2: The scatter plot below shows the relationship between the number of hours a student plays golf and the student’s class attendance. Which of the following types of correlation is shown on the scatter plot?
A. Positive
B. Positive and negative
C. No correlation
D. Negative
Answer Explanation
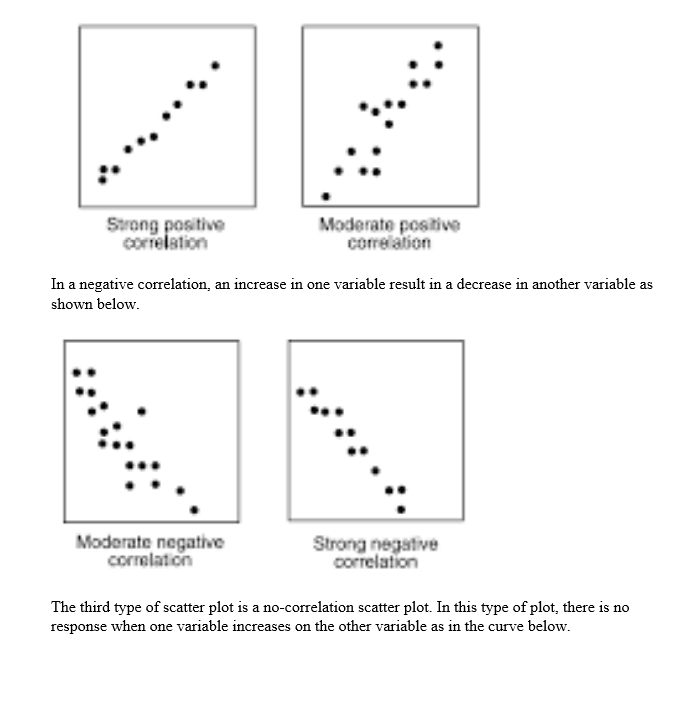
Scatter plots can depict three correlations: positive, negative and no correlation. A positive correlation scatter plot reveals that as one variable increases, the other variable also increases as shown below
-
Q #3: 3.60*0.75 Simplify the expression above. Which of the following is correct?
A. 0.027
B. 27
C. 0.27
D. 2.7
Answer Explanation
To solve the equation this equation, we compute the multiplication of the two numbers using the calculator
3.60 * 0.75 = 2.7

